|
|
|
Data Analysis

Our system offers you a variety of different data analyzation tools.
Both individual patient responses and overall outcomes trends can be
monitored using the collection of graphs, charts, and other utilities
available on our site. Click on the pictures below to learn more about the
data analyzation tools that we offer:
Select Patient:
|
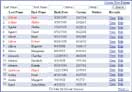
View Data:
|
Patient Graphs:
|
Quality Dashboards:
|
Practice Dashboards:
|
Patient Dashboards:
|
Aggregate Data:
|
Queries:
|
DataBeacon:
|
|
|
|
|
|
|
|
|
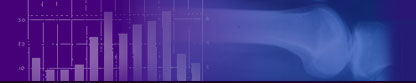
Aggregate Data
With aggregate data, trends can be revealed and treatments can be compared, thus paving
the way for improved quality of care. Below is a screen shot of one of our aggregate data
tools. Each dot in this scatter report represents an individual patient's evaluation. Drill-
down enabled graphs allow you to identify an individual directly from the graph, and overlaid
line graphs let you compare the dots to database averages. These tools are highly customizable
and are great for identifying outliers. Additionally, basic statistical tools are built right
in so that you can calculate the significance of differences between populations.
|

|
|
|
|